-(2).png)
The Growth Report
The Growth Report has replaced the Growth Gauge.
The Growth Report summarizes data for a selected group of students and generates pairs of bar graphs showing their progress over a specified date range. The completed report can be downloaded as a one-page PDF.
The Growth Report is currently in Beta.
Before generating a Growth Report, the teacher or administrator may want to use the Filter tool to determine which students will be included in the report.
To generate a Growth Report:
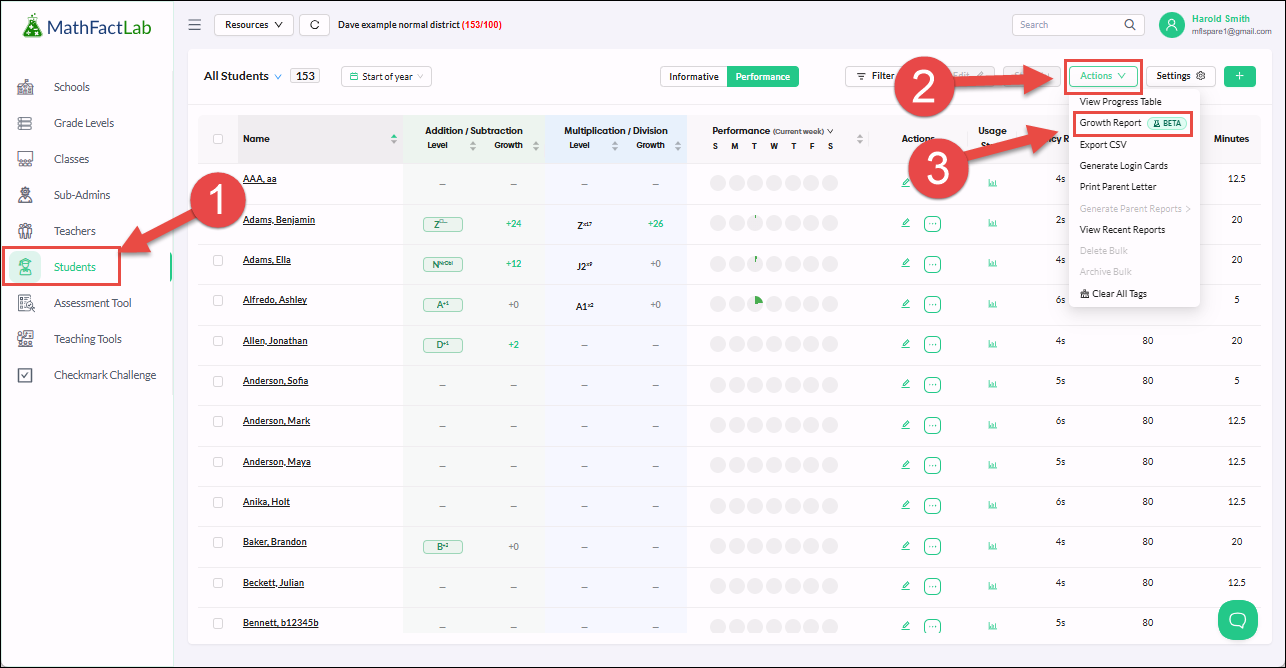
- Start on the Students Tab and
- Filter students if necessary, such as by school, grade level, class or tag.
- Click on the Actions Menu.
- Choose Growth Report.
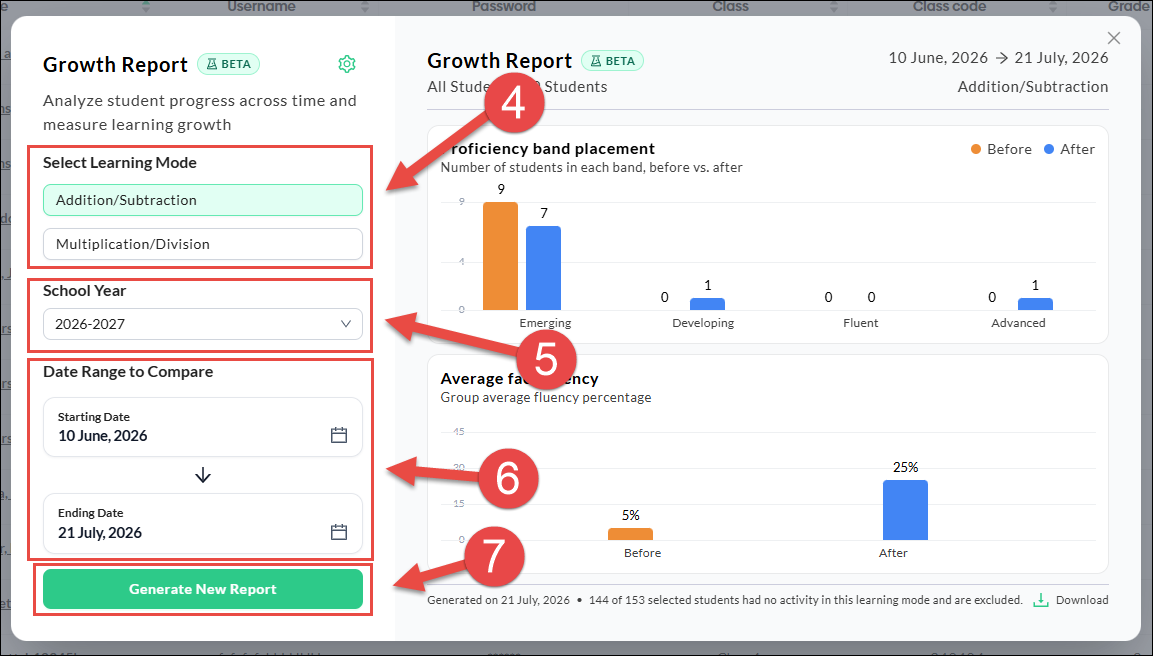
In the Growth Report Menu, choose:
- The Learning Mode for the report, either Addition/Subtraction, or Multiplication/Division
After generating the report, a notice will be displayed below the graphs explaining the number of students excluded from the graph because they had no activity in the chosen Learning Mode for the date range selected.
- The School Year, currently 2026-2027 or 2025-2026.
- The Date Range to compare
- After making these selections, click on the Generate New Report button to create the report.
Modifying the Report
Several settings are available to allow you to customize the report to meet your needs.
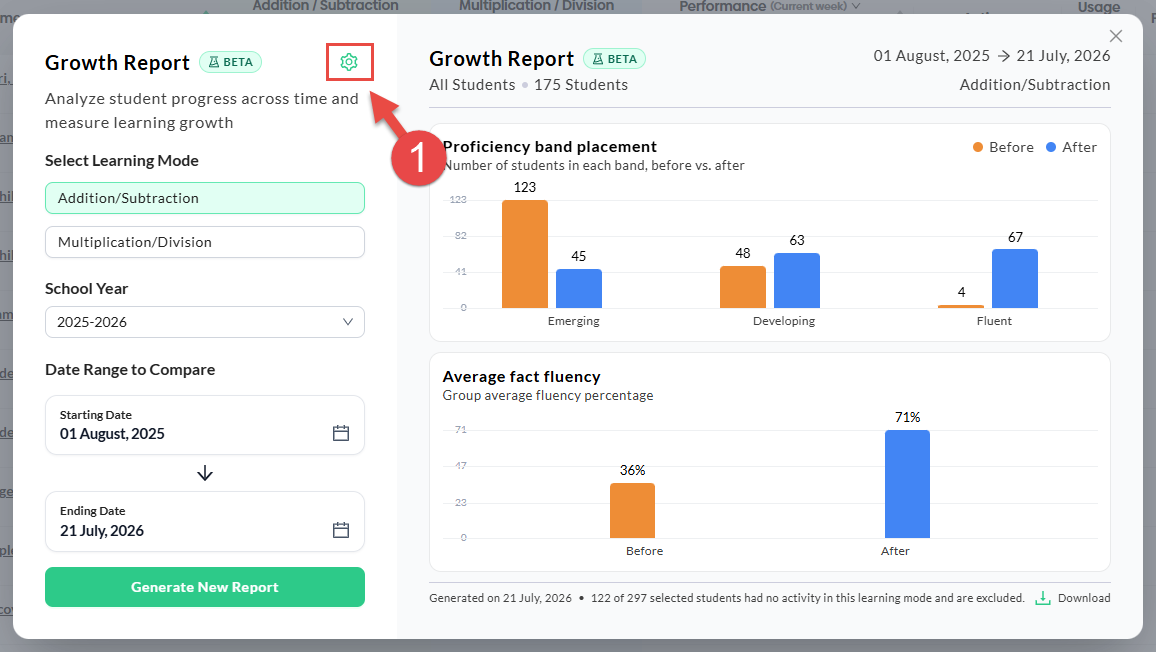
To change the Growth Report Settings:
- Click on the Gear icon.
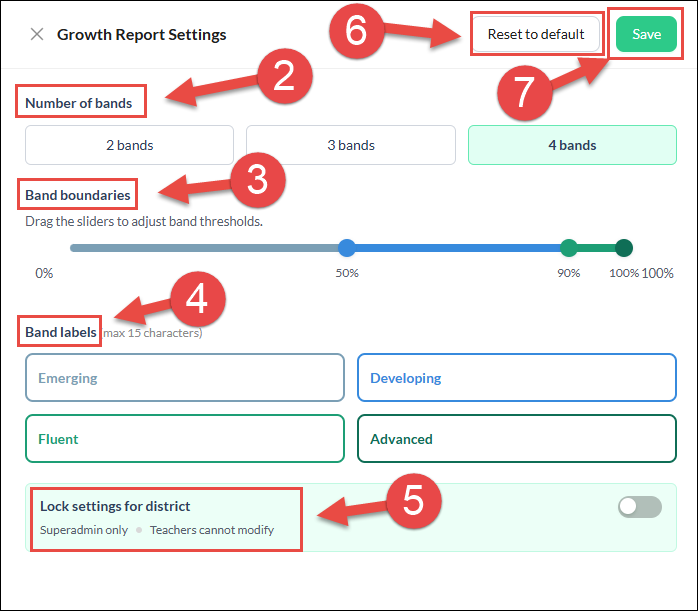
- Choose the Number of bands into which your students will be placed.
- After choosing the number of bands, you can modify the thresholds or Band Boundaries.
- You may change the Band labels.
- To ensure consistency, the account's Super Administrator may decide to lock the district's settings.
- The Reset to default button will return all settings to their original configuration.
- Click the Save button to retain these settings.
After changing settings, you will need to click on the Generate New Report button again to enable these changes.
Reading the Report
Below is an example Growth Report using the default settings for the number of bands, the band boundaries, and labels.
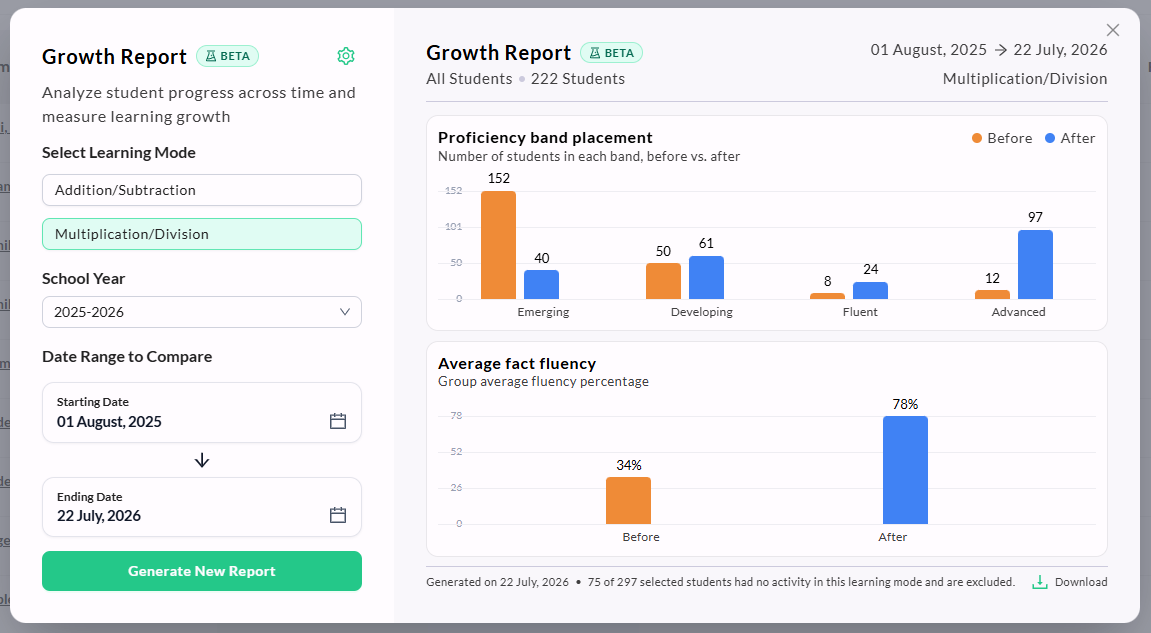
The Proficiency Band Placement graph groups students according to their before and after estimated fluency levels and the fluency thresholds selected for each band. It shows how many students were in each band at the beginning and end of the selected date range. (Click here to learn how estimated fluency levels are determined.)
The example above uses the default settings, so the default range for the Emerging band is 0%–50% mastery of basic multiplication and division fluency. Before August 1, 2025, 152 students were in this range. As of July 22, 2026, that number had decreased to 40 students.
The Average Fact Fluency chart compares the average fluency attainment of all selected students at the beginning and end of the specified date range.
In the example above, the students’ average multiplication and division fluency attainment was 34% before August 1, 2025, and 78% after July 22, 2026.