Creating Usage Stats Reports
Tracking progress helps ensure students steadily improve their math fact fluency. This guide shows how to create and use Usage Stats Reports to monitor individual students or larger groups. Reports are easy to generate, offer detailed insights, and can be customized by date range, filters, sorting, and exporting to fit your needs.
Individual Usage Stats Reports
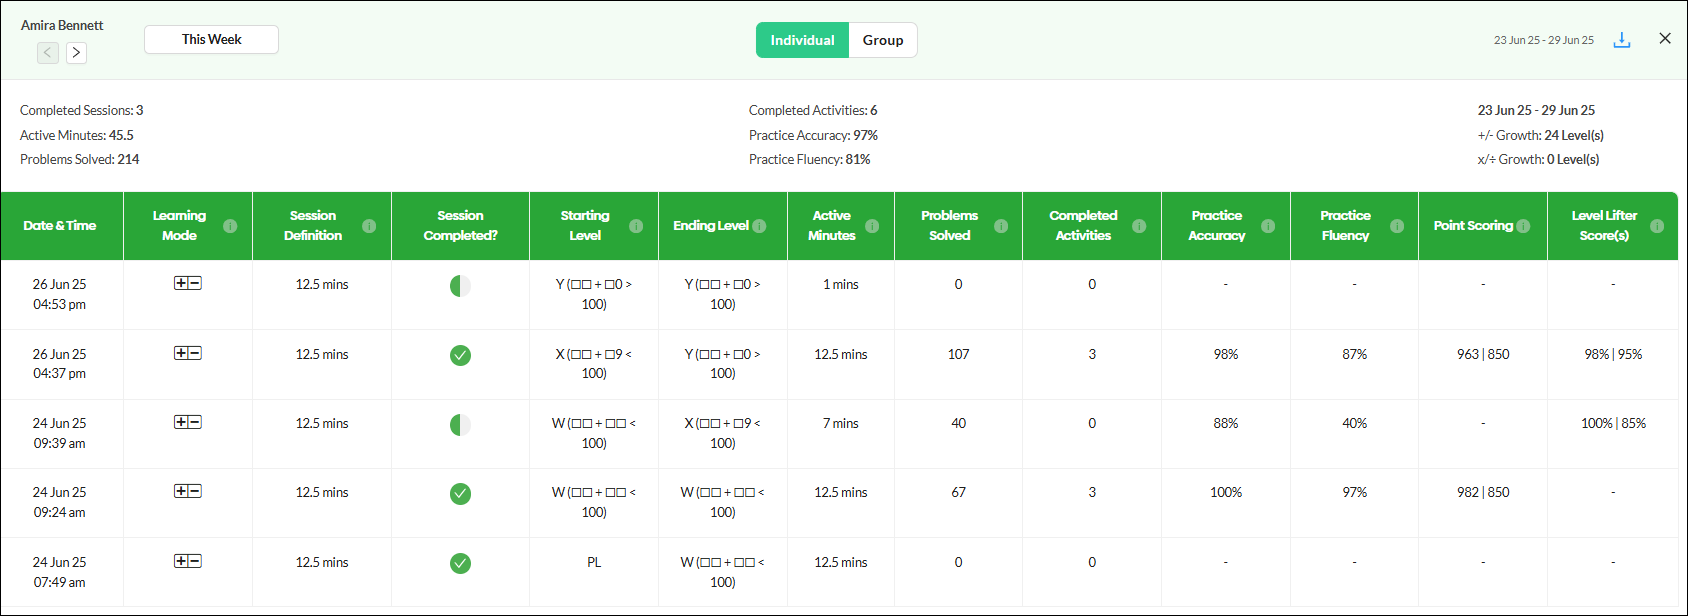
Individual Usage Stats Reports can be generated for as many or as few students as required. These reports will provide thirteen data points arranged in a grid for a chosen range of dates.
These data points are covered in greater detail here, or you can hover over the information icon next to each header to learn more.
These reports may be exported as PDF or CSV files. Exported files are delivered via email. Previously exported reports may be downloaded by following the directions in this help document.
How to Generate Individual Usage Stats Reports
- Choose either the Informative or the Performance view of the Students tab.
- Select the students you wish to include by clicking on individual student checkboxes or clicking on the checkbox at the top of that column to select all the students. You can also use the Filter to select students for a report who meet one or more criteria, including their school, class, grade level or any tags that may have been assigned.
- Click on the 'Stats' button.

- In the Progress Report window select the 'Individual' view.
- If you are not seeing the entire report use the scroll bar to move right and left or change your zoom setting to see more of your screen.
- If you have chosen more than one student to be included you can move to the next or previous student's report by clicking on these forward and back arrows.
- Change the date range of the report by using this drop-down menu. The date range chosen will be saved as the default choice the next time the Stats button is clicked.
- Click on this export icon to download a PDF or CSV version of the report.


Across the top of the Individual Stats reports is a summary of eight key measures of student progress for the date range you have selected.

Group Usage Stats Report
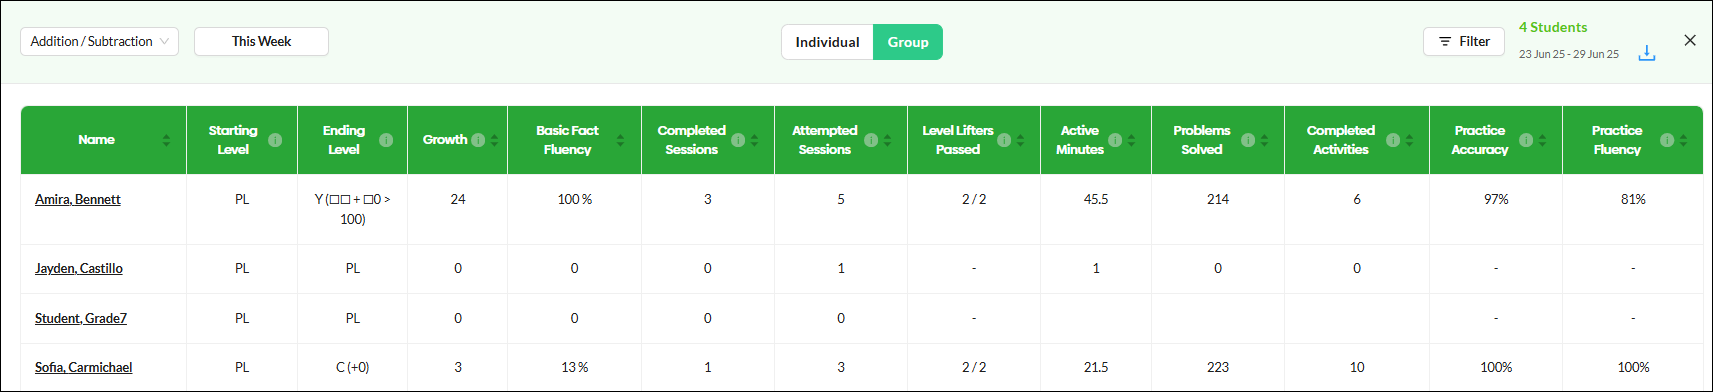
The Group Usage Stats report includes 12 data points for each of the students selected. The date range for the data in the report and the learning mode can be adjusted from within the report.
These data points are covered in greater detail here, or you can hover over the information icon next to each header to learn more.
These reports may be exported as PDF or CSV files. Exported files are delivered via email. Previously exported reports may be downloaded by following the directions in this help document.
How to Generate Group Usage Stats Reports:
- Navigate to the Informative or Performance view of the Students tab.
- Select the students you wish to include by clicking on individual student checkboxes or clicking on the checkbox at the top of that column to select all the students. You can also use the Filter to select students who meet one or more criteria, including their school, their class, their grade level or any tags that may have been assigned.
- Click on the 'Stats' button.
- In the Progress Report window select the 'Group' view.
- If you are not seeing the entire report use the scroll bar to move right and left or change your zoom setting to see more of your screen.
|
|
Use this menu to change the Learning Mode to either Addition/Subtraction or Multiplication/Division. The Learning Mode chosen will be saved as the default choice and seen the next time the Stats button is clicked. If a student has not worked within the selected Learning Mode, dashes will be displayed for that student. |

|
|
Change the date range of the report by using this drop-down menu. The date range chosen will be saved as the default choice the next time the Stats button is clicked. Selections of Leaning Mode and Date range are saved so teachers don’t have to select each time they open Usage Stats |

- Use the 'Filter' button to choose a subset of the students you are currently seeing in the report. For each of the four filtering options you may choose one or more of the schools, grades, classes or tags listed. You must click on the 'Apply Filter' button to activate your filtering options.
- Use these up and down arrow icons to re-sort the table using the information in the chosen column.
- Click on this export icon to download a PDF or CSV version of the report.


|

|


Individual Student Support - If a student's name is highlighted in yellow or red, it indicates that the student has not passed a level within the specified number of days. This feature will alert teachers when students may require some level of support. Clicking on a student's name in the Group report will bring up a pop-up window with information about their current status and a link to a help document for issues the student may be having. See this document for more information about the color-coding of student names to indicate possible progress issues.

@Zoho