MathFactLab Reports
Report Options
Tracking progress helps ensure students steadily improve their math fact fluency. There are multiple reports available to MathFactLab users. Reports are easy to generate. See the descriptions below for a better idea of the kind of information each provides. Click on the links below to learn more.
- Usage Stats Report - Very detailed data for individuals and groups of students
- Placement Test Reports - Question-by-question placement test accuracy and fluency
- Level Lifter Reports - question-by-question responses on the most recent Level Lifter assessment
- Reports for Parents/Guardians - A one-page summary of each child's progress in MathFactLab up to that point.
- Growth Gauge - Graph of level-by-level growth for an entire class
- Quick Summary Report - a snapshot of progress since their initial placement test
- .csv File - download a spreadsheet with essential student information
- Classes tab and Schools tab - reports for administrators
Usage Stats Report
Usage Stats Reports allow you to monitor individual students or groups. Reports are easy to generate, offer detailed insights, and can be customized by date range, filters, sorting, and exporting to fit your needs. These reports can be exported as CSV or PDF files. The reports will be sent to the Administrator or teacher via email. Previously exported reports may be downloaded by following the directions in this help document.
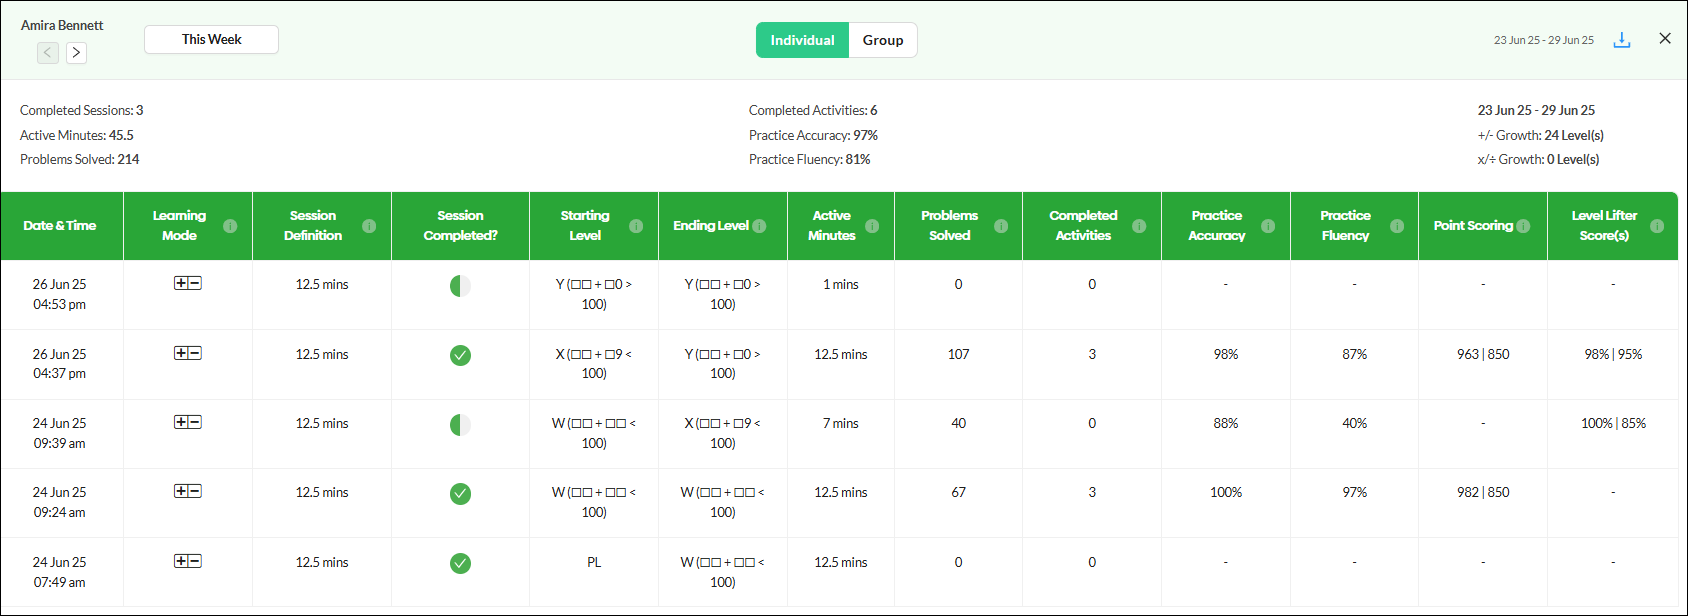
Individual Usage Stats Reports can be generated for as many or as few students as required. These reports will provide thirteen data points arranged in a grid for a chosen range of dates.
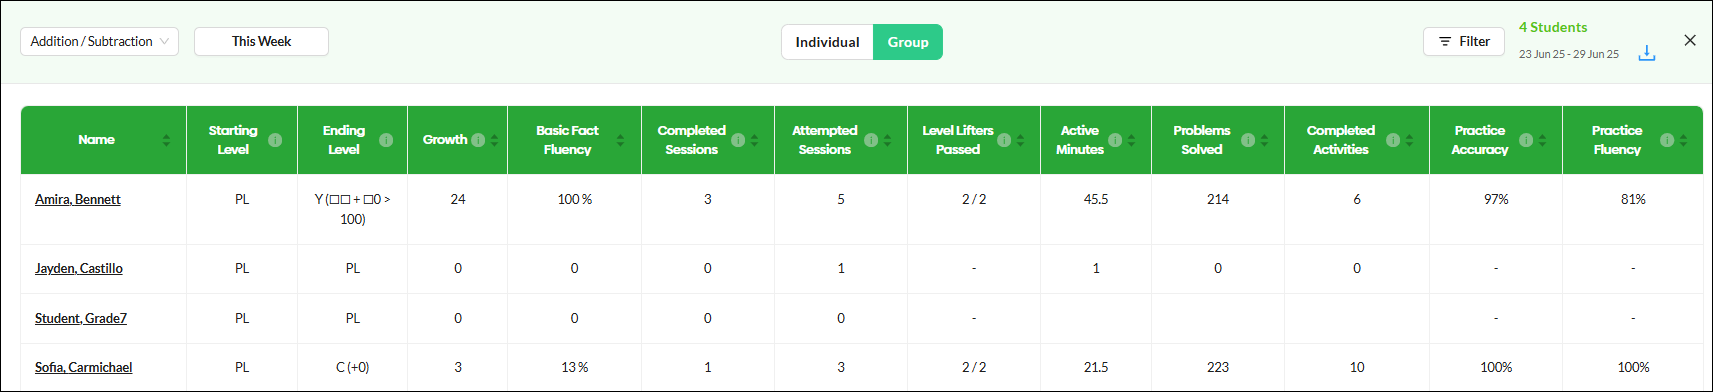
Group Usage Stats Reports include twelve data points for each student. The date range for the data in the report and the learning mode can be adjusted from within the report.
Detailed information about these reports and how to create them is found here: Creating Usage Stats Reports
Placement Test Reports
Placement test reports provide question-by-question results from the placement test.
Each student response is color-coded: (A)
- Green for correct and fluent
- Yellow for correct but not yet fluent
- Red for incorrect response.
Student response time is provided as well for each question. (B)
Placement test reports may be exported as CSV or PDF files. (C) These reports can be downloaded immediately.
The placement determination from the assessment will be seen at the top of the screen. (D)

More details about Placement Test Reports and how to create them are found here: Placement Test Reports
Level Lifter Reports
Level Lifter reports include a student's question-by-question responses and follow the same format as Placement Test reports.
- Green for correct and fluent
- Yellow for correct but not yet fluent
- Red for an incorrect response.
- Student response time is provided for each question.
Level left reports can be immediately downloaded as PDF or CSV files.
To find a report on the student's most recent Level Lifter, just click the letter of the student's current level. If a student has not taken any Level Lifter assessments, you will be taken to their Placement Test Report.
If you wish to see the reports for any of a student's Level Lifter attempts, go to the 'Level Lifter Scores' column in the Usage Stats window for that student. Click on any score to see the Level Lifter report.
More details about Level Lifter Reports and how to create them are found here:
Reports for Parents/Guardians
You can now generate reports to share with your students’ parents. These reports provide an up-to-date summary of their child’s progress.
Students must be selected before you will be able to generate Parent Reports.
Below is an example of a Parent Report.

Reports are sent to the teacher or administrator via email. Instructions on how to generate Parent Reports can be found in this document.
Growth Gauge
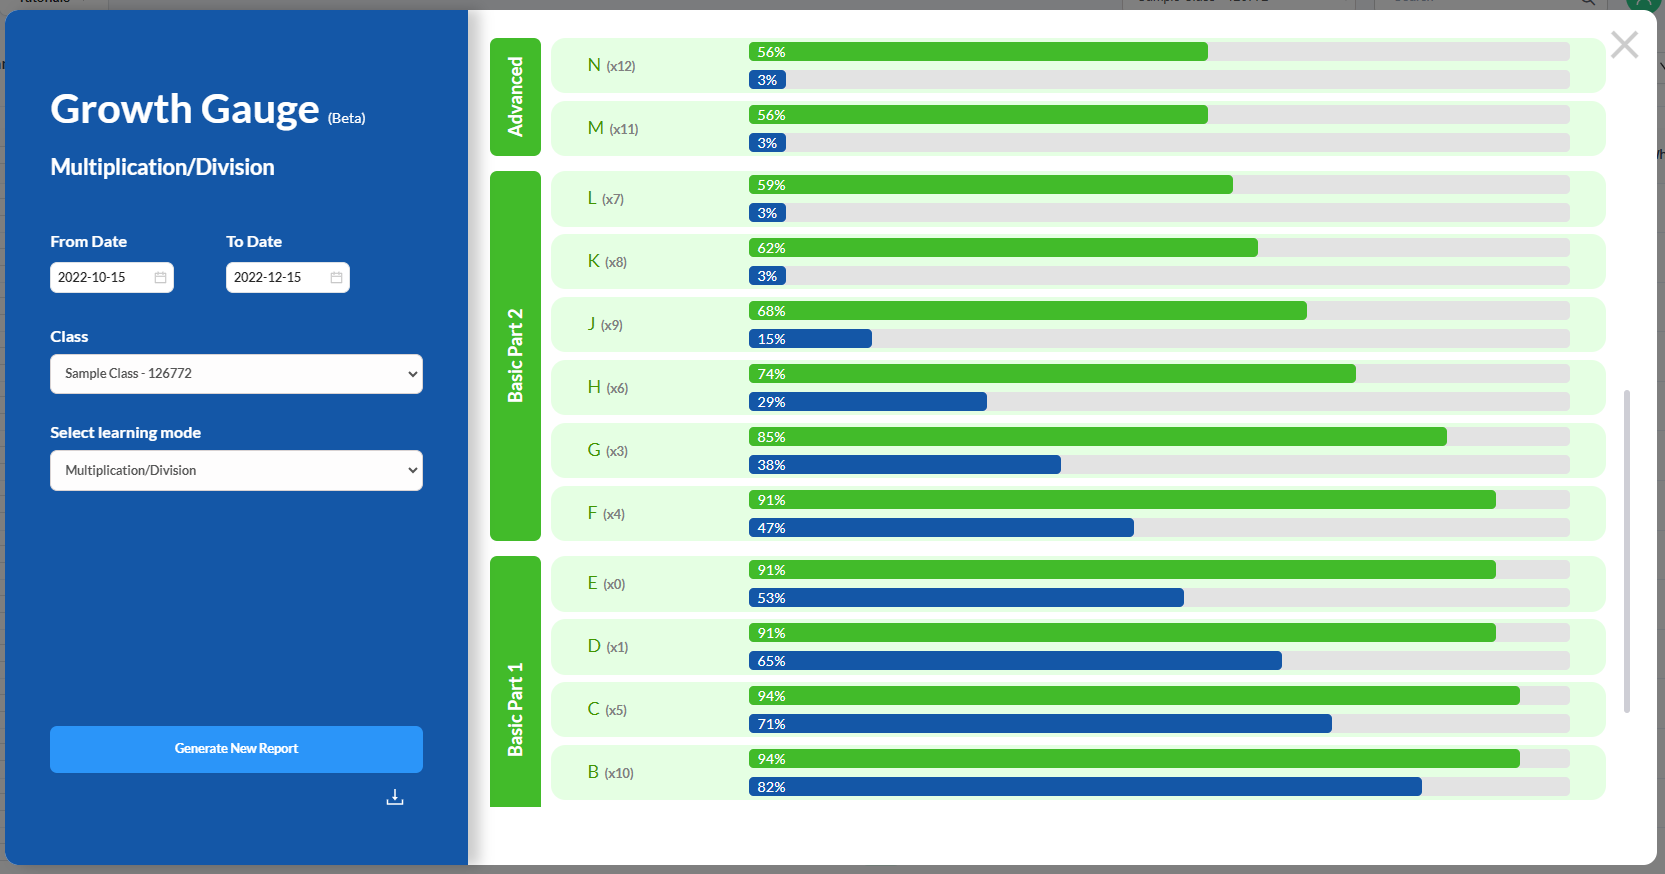
The Growth Gauge gives you a quick overview of how much progress one or all of the classes have made during a selected time period.
For each level:
- The blue percentage shows how many students were at that level at the beginning of the time period.
- The green percentage shows how many students had reached that level by the end of the time period.
If you hover your mouse over any percentage, a pop-up will appear showing the names of the students included in that group.
The Growth Gauge report may be exported immediately as a CSV file.
More details about Growth Gauge Reports and how to create them are found here: Creating a Growth Gauge Report
Quick Summary Report
By clicking on an individual student's name on the Students tab, you can quickly see an overview of a student's progress and activity for either learning mode (+/- or x/÷):


.csv File
By clicking Export CSV under the Actions button on the Students tab, you can download a .csv file of essential information on the Students tab in a spreadsheet format. This might be helpful for having quick access to all your students' login information, usernames, class codes, current settings, etc..


Classes Tab and Schools Tab Reports for Administrators
School/District accounts offer administrators the ability to see a summary of student usage by class or by school.
Click here to learn more.
@zoho